11 graphics 入门
不是把每个绘图函数都挨个讲一遍,也不是把它们统统归纳总结,而是比较深入地介绍一、两种图形,一、两个例子,重点阐述 Base R 的绘图特点,使用图形时,注意图形本身的作用,最终,希望读者能够达到举一反三的效果。
基础绘图系统。相比于 ggplot2 和 lattice,graphics 制作示意图是优势。
11.1 绘图基础
利用点、线等基础元素从零开始绘图。
11.1.1 plot()
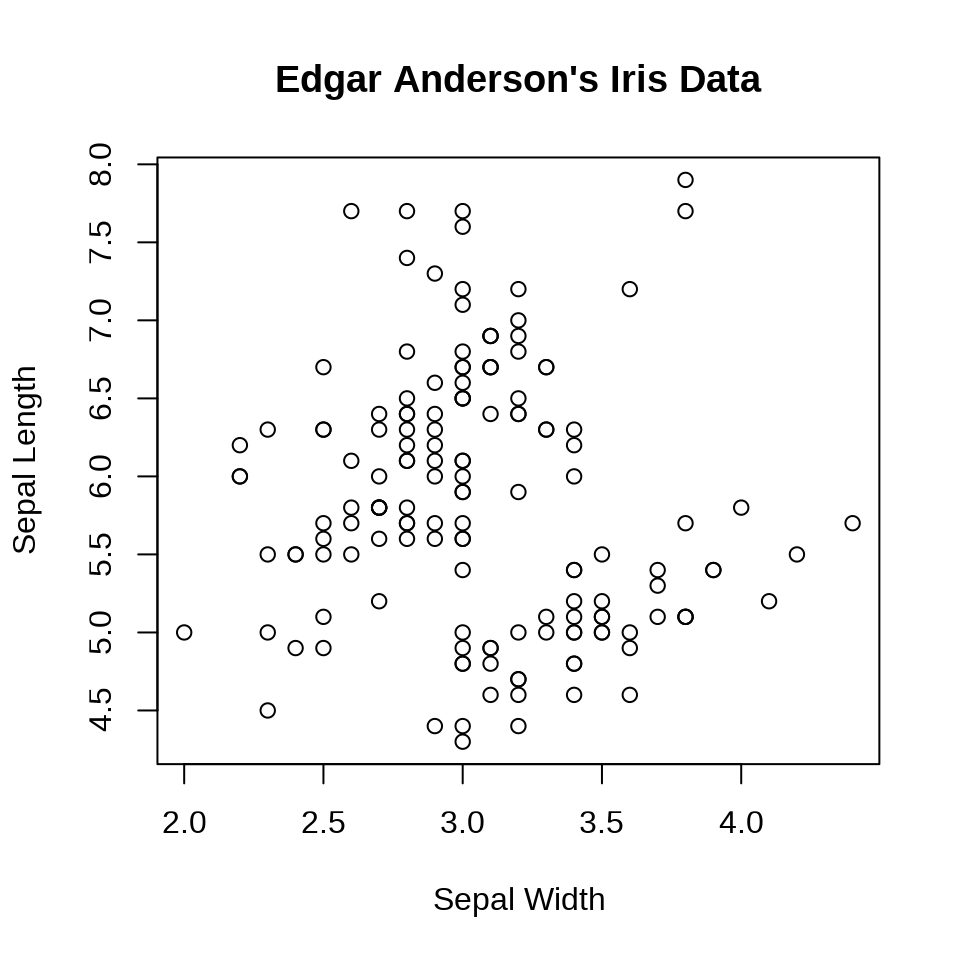
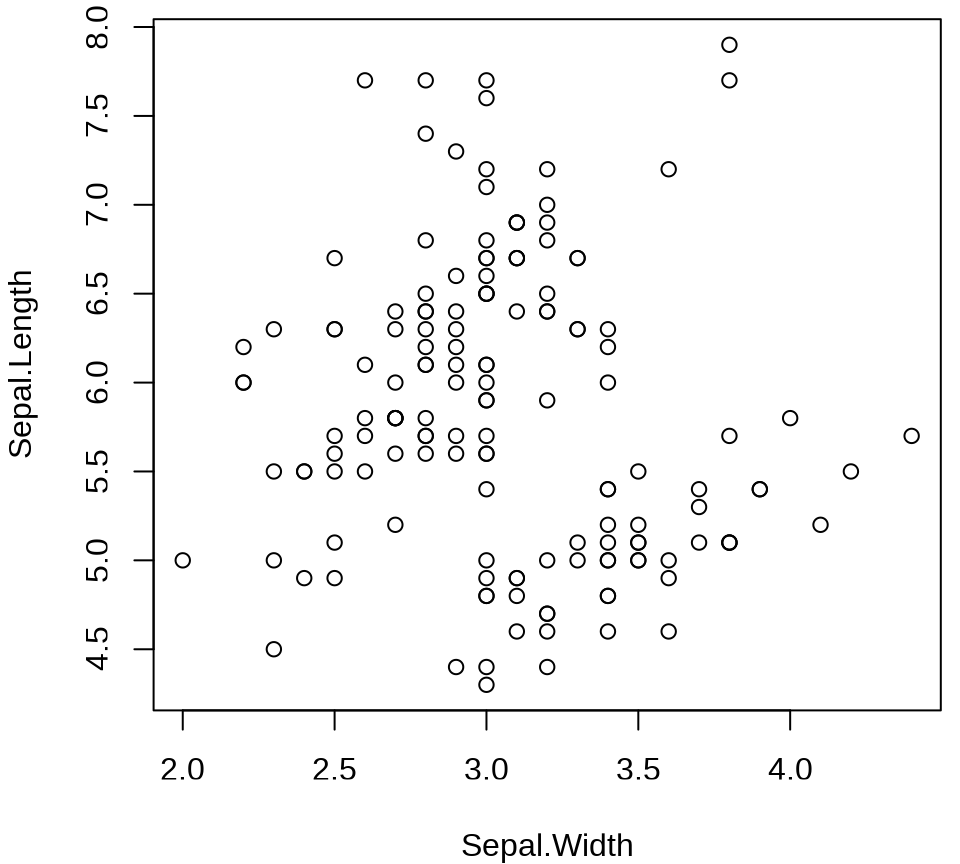
函数 plot() 快速作图
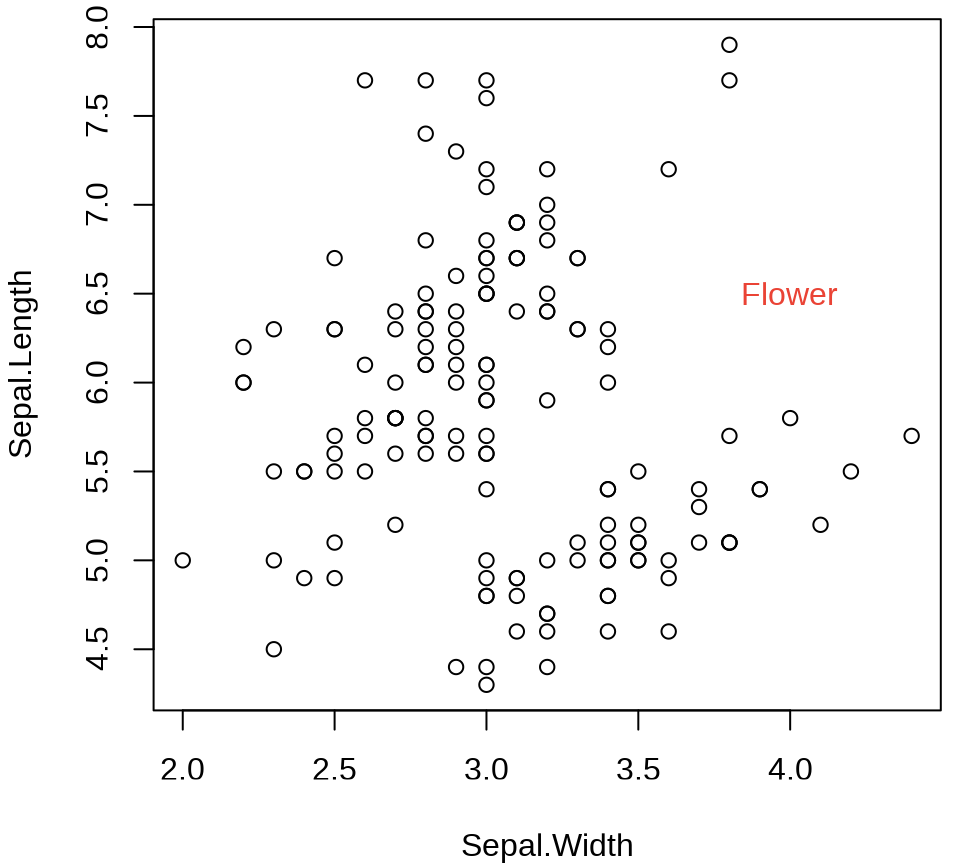
11.1.2 标签
11.1.3 分组
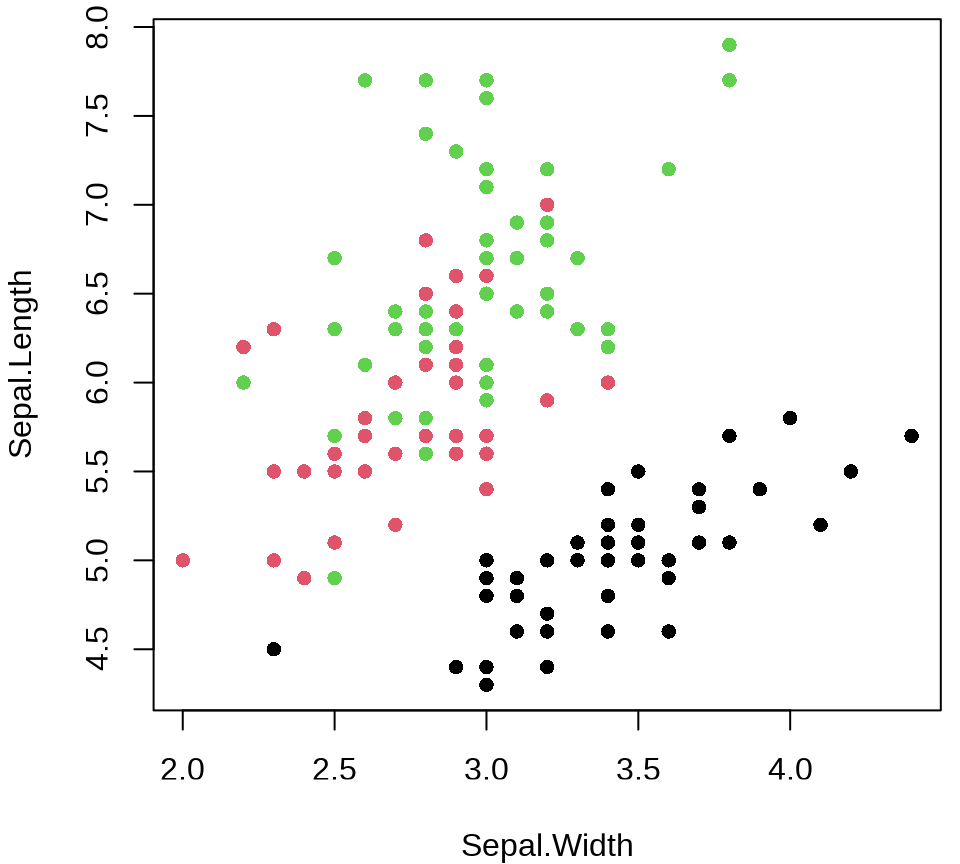
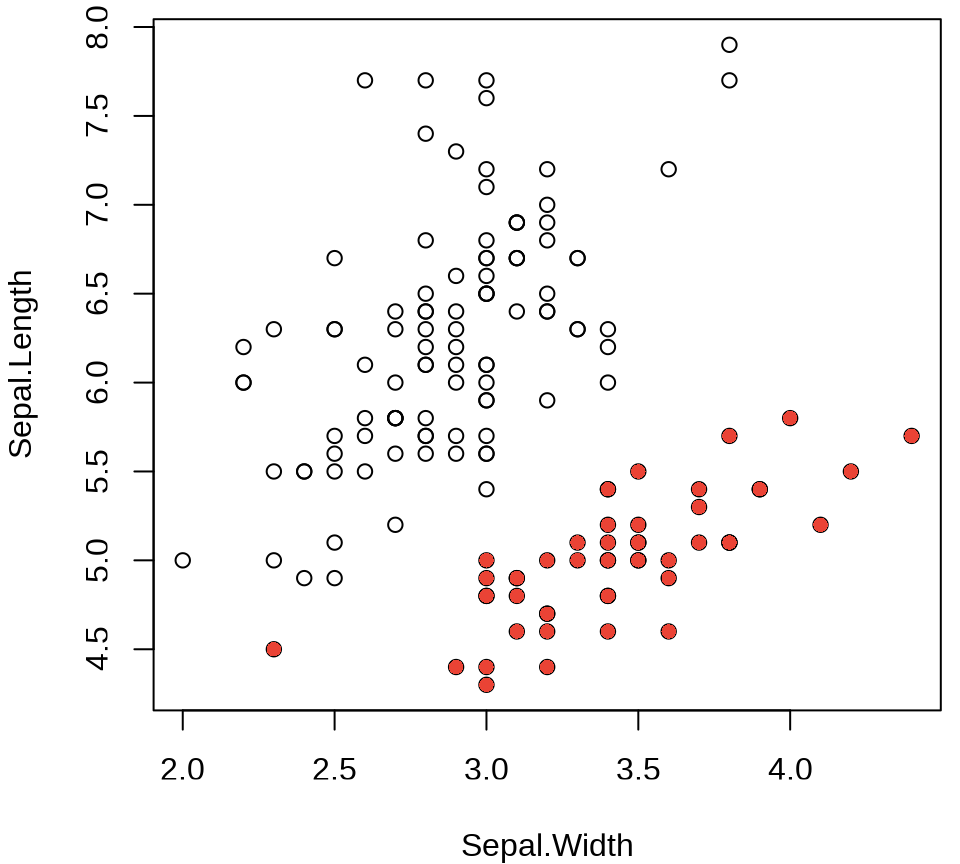
高亮显示某一部分数据达到区分的目的,分组
plot(Sepal.Length ~ Sepal.Width, data = iris)
points(Sepal.Length ~ Sepal.Width,
  col = "#EA4335", pch = 16,
  data = subset(iris, Species == "setosa")
)
col 参数传递一个数据列
11.1.4 配色
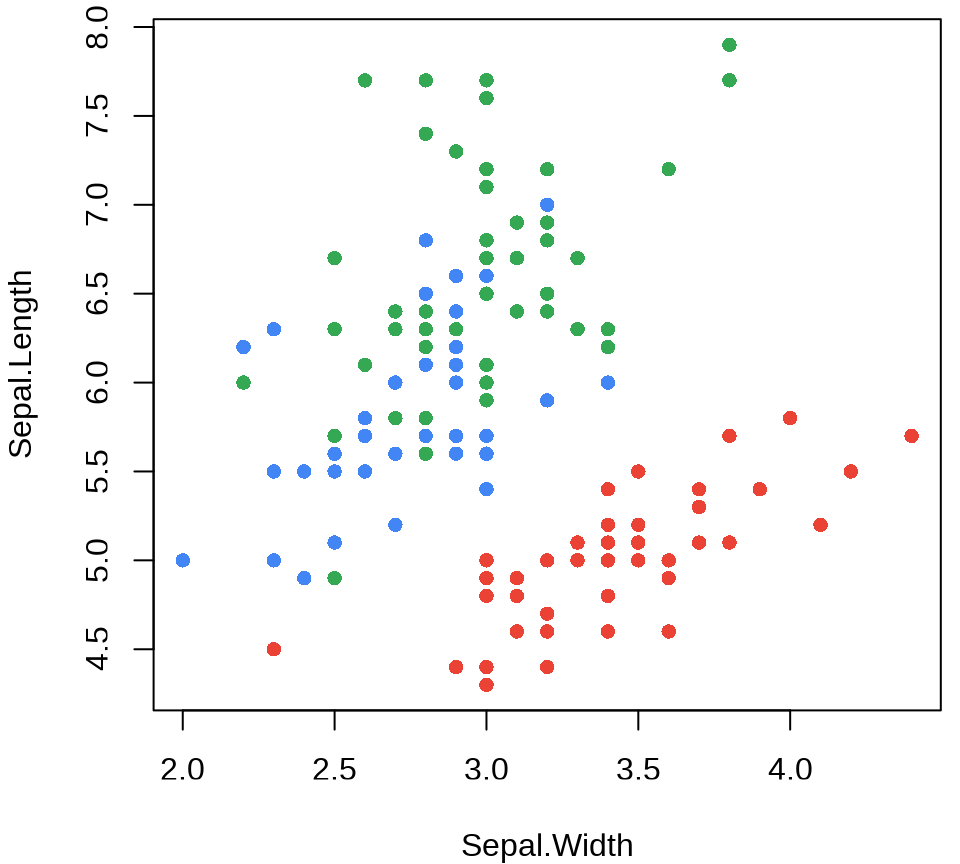
经过探查,知道 Species 有三种取值,设置一个超过 3 种颜色的调色板,实现自定义配色
#> [1] "black"   "#DF536B" "#61D04F" "#2297E6" "#28E2E5" "#CD0BBC" "#F5C710"
#> [8] "gray62"#> [1] "#EA4335" "#4285F4" "#34A853" "#FBBC05"11.1.5 注释
11.1.6 图例
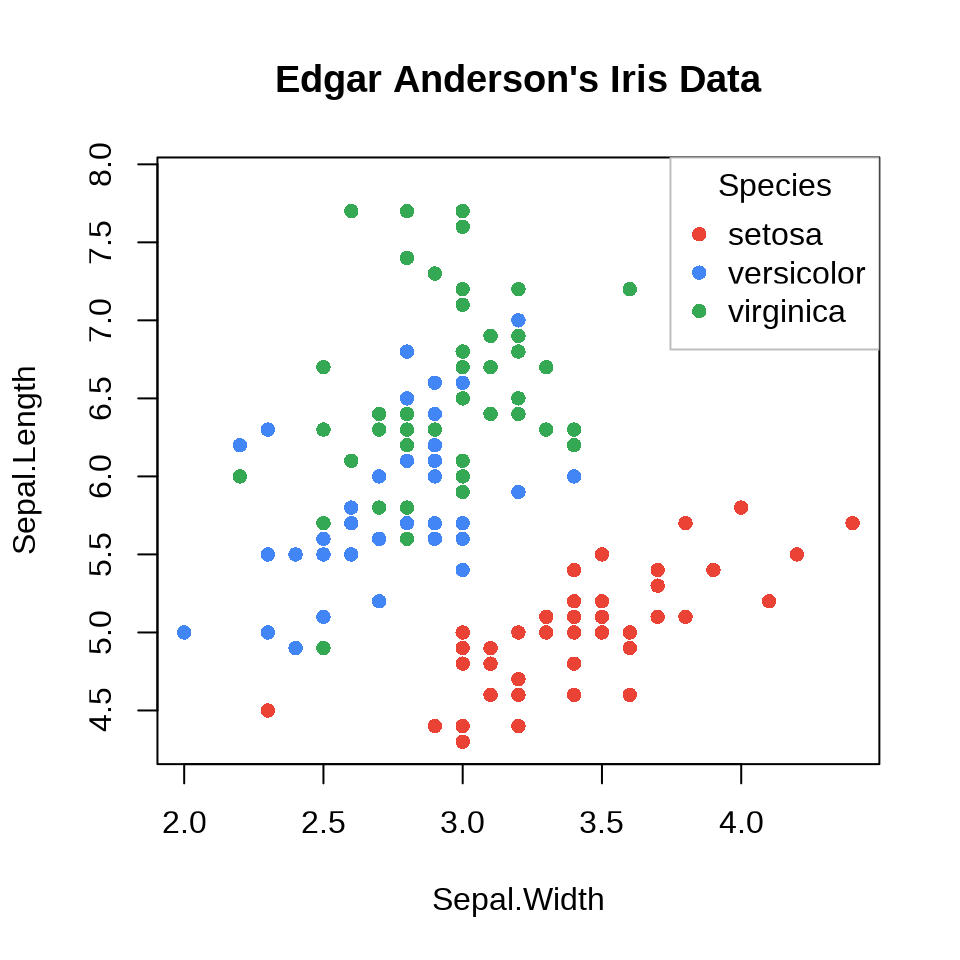
函数 legend()
plot(
  Sepal.Length ~ Sepal.Width,
  data = iris, col = Species, pch = 16,
  main = "Edgar Anderson's Iris Data"
)
legend("topright", title = "Species",
  legend = unique(iris$Species), box.col = "gray",
  pch = 16, col = c("#EA4335", "#4285f4", "#34A853")
)
图例放置在绘图区域以外的边空区域
op <- par(mar = c(4, 4, 3, 6))
plot(
  Sepal.Length ~ Sepal.Width, data = iris,
  col = Species, pch = 16, main = "Edgar Anderson's Iris Data"
)
text(x = 4.7, y = 6.75, labels = "Species", pos = 4, offset = .5, xpd = T)
points(x = 4.7, y = 6.5, pch = 16, cex = 1, col = "#EA4335", xpd = T)
text(x = 4.7, y = 6.5, labels = "setosa", pos = 4, col = "#EA4335", xpd = T)
points(x = 4.7, y = 6.3, pch = 16, cex = 1, col = "#4285f4", xpd = T)
text(x = 4.7, y = 6.3, labels = "versicolor", pos = 4, col = "#4285f4", xpd = T)
points(x = 4.7, y = 6.1, pch = 16, cex = 1, col = "#34A853", xpd = T)
text(x = 4.7, y = 6.1, labels = "virginica", pos = 4, col = "#34A853", xpd = T)
on.exit(par(op), add = TRUE)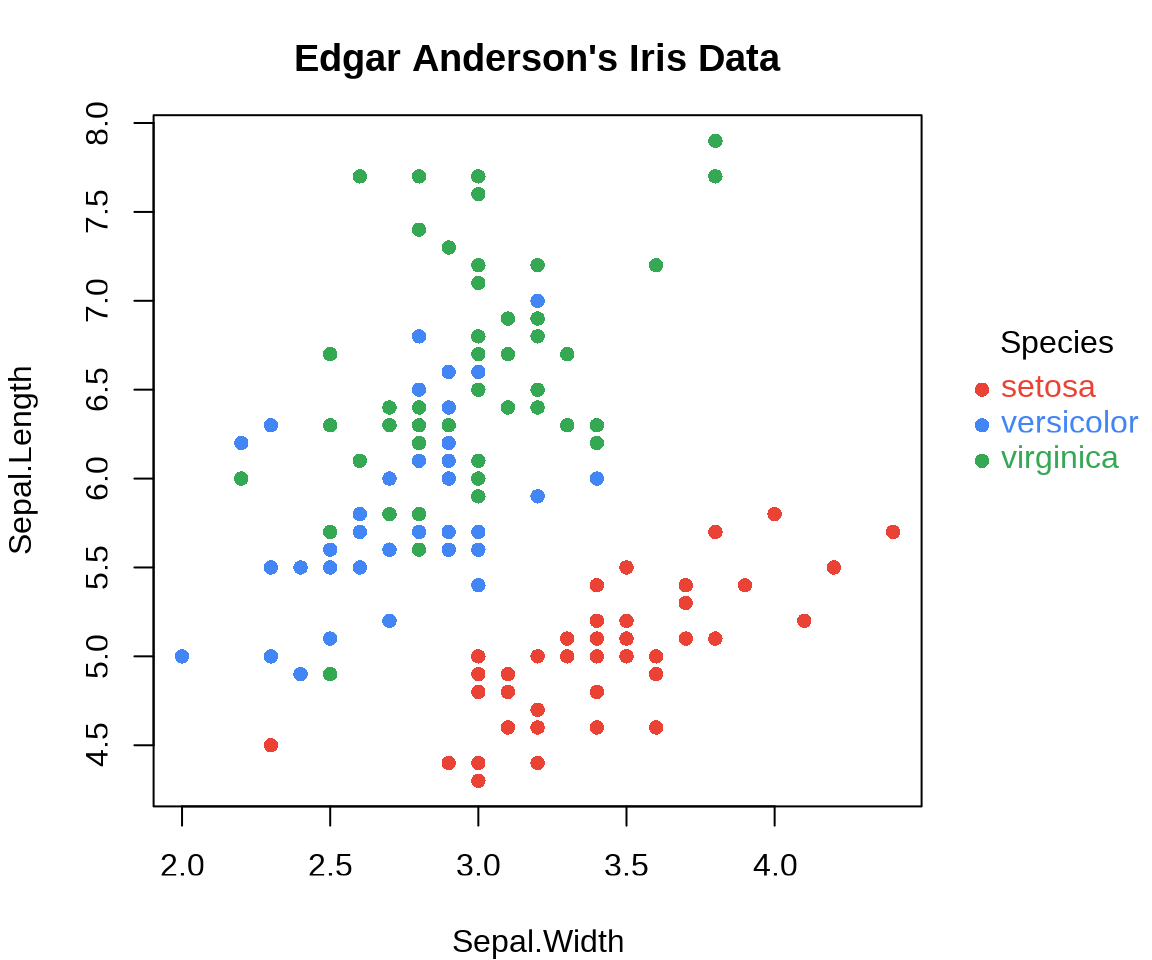
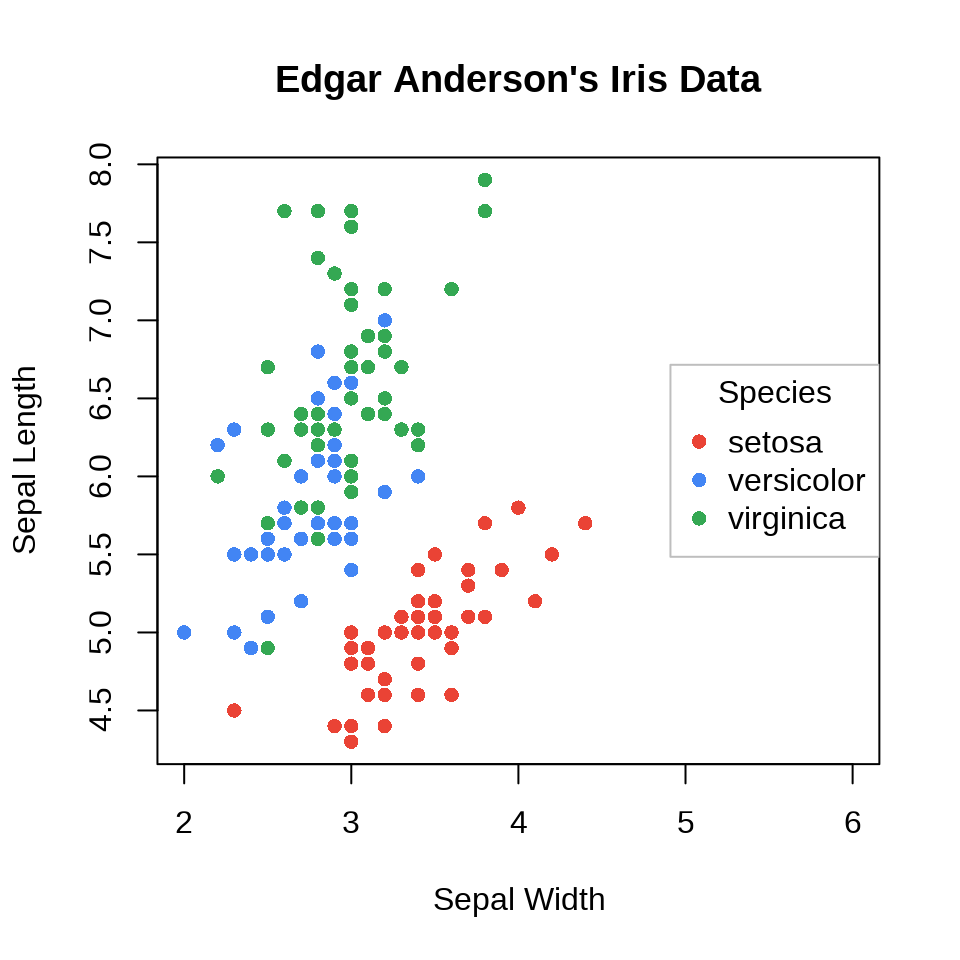
先申请一个较宽的区域
plot(
  x = c(2, 6), y = range(iris$Sepal.Length), type = "n",
  xlab = "Sepal Width", ylab = "Sepal Length",
  main = "Edgar Anderson's Iris Data"
)
points(Sepal.Length ~ Sepal.Width,
  col = Species, pch = 16, data = iris
)
legend("right",
  title = "Species",
  legend = unique(iris$Species), box.col = "gray",
  pch = 16, col = c("#EA4335", "#4285f4", "#34A853")
)
11.1.7 统计
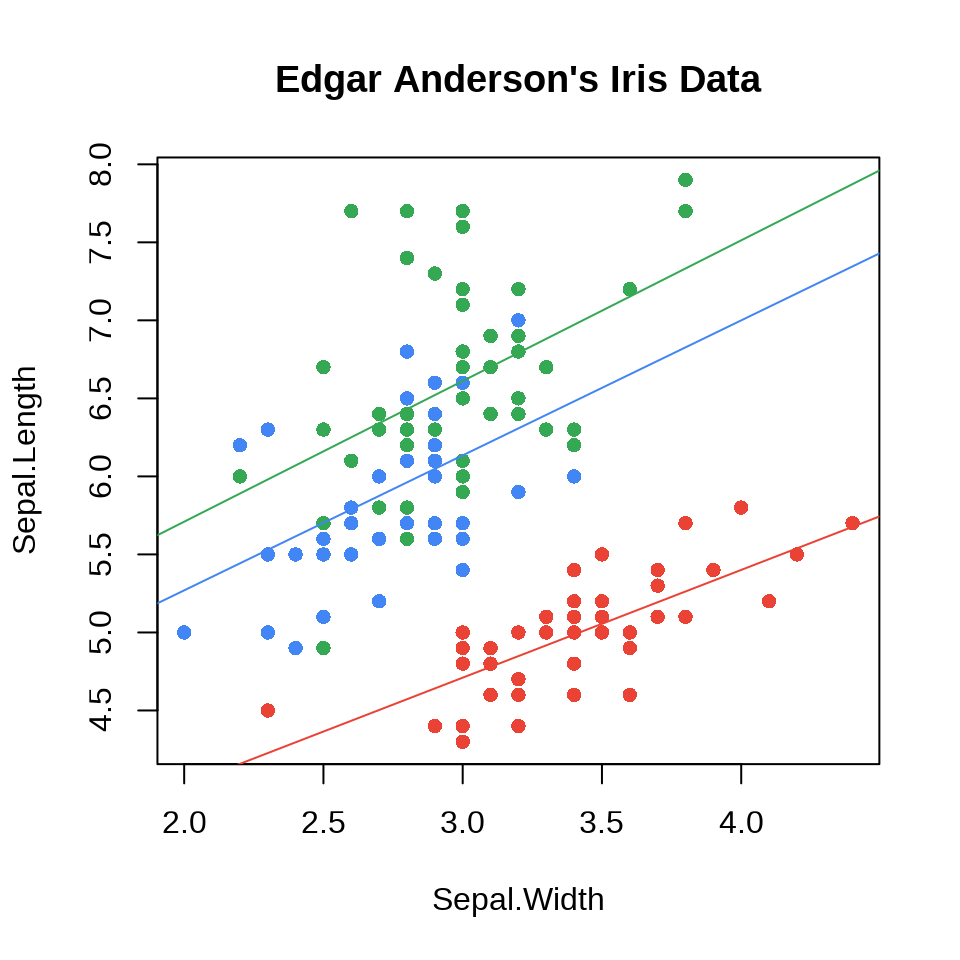
添加分组线性回归线
#> $setosa
#> (Intercept) Sepal.Width
#>   2.6390012   0.6904897
#>
#> $versicolor
#> (Intercept) Sepal.Width
#>   3.5397347   0.8650777
#>
#> $virginica
#> (Intercept) Sepal.Width
#>   3.9068365   0.9015345
往往是各方面比较清楚,分类数量、调色板都确定下来了
iris_lm <- lapply(
  split(iris, ~Species), lm,
  formula = Sepal.Length ~ Sepal.Width
)

cols <- c(
  "setosa" = "#EA4335",
  "versicolor" = "#4285f4",
  "virginica" = "#34A853"
)

plot(
  Sepal.Length ~ Sepal.Width,
  data = iris, col = Species, pch = 16,
  main = "Edgar Anderson's Iris Data"
)

for (species in c("setosa", "versicolor", "virginica")) {
  abline(iris_lm[[species]], col = cols[species])
}
11.2 绘图进阶
11.2.1 组合图形
点、线、多边形组合
x <- seq(-10, 10, length = 400)
y1 <- dnorm(x)
y2 <- dnorm(x, m = 3)
op <- par(mar = c(5, 4, 2, 1))
plot(x, y2,
  xlim = c(-3, 8), type = "n",
  xlab = quote(Z == frac(mu[1] - mu[2], sigma / sqrt(n))),
  ylab = "Density"
)
polygon(c(1.96, 1.96, x[240:400], 10),
  c(0, dnorm(1.96, m = 3), y2[240:400], 0),
  col = "grey80", lty = 0
)
lines(x, y2)
lines(x, y1)
polygon(c(-1.96, -1.96, x[161:1], -10),
  c(0, dnorm(-1.96, m = 0), y1[161:1], 0),
  col = "grey30", lty = 0
)
polygon(c(1.96, 1.96, x[240:400], 10),
  c(0, dnorm(1.96, m = 0), y1[240:400], 0),
  col = "grey30"
)
legend(x = 4.2, y = .4,
  fill = c("grey80", "grey30"),
  legend = expression(
    P(abs(Z) > 1.96, H[1]) == 0.85,
    P(abs(Z) > 1.96, H[0]) == 0.05
  ), bty = "n"
)
text(0, .2, quote(H[0]:~ ~ mu[1] == mu[2]))
text(3, .2, quote(H[1]:~ ~ mu[1] == mu[2] + delta))
on.exit(par(op), add = TRUE)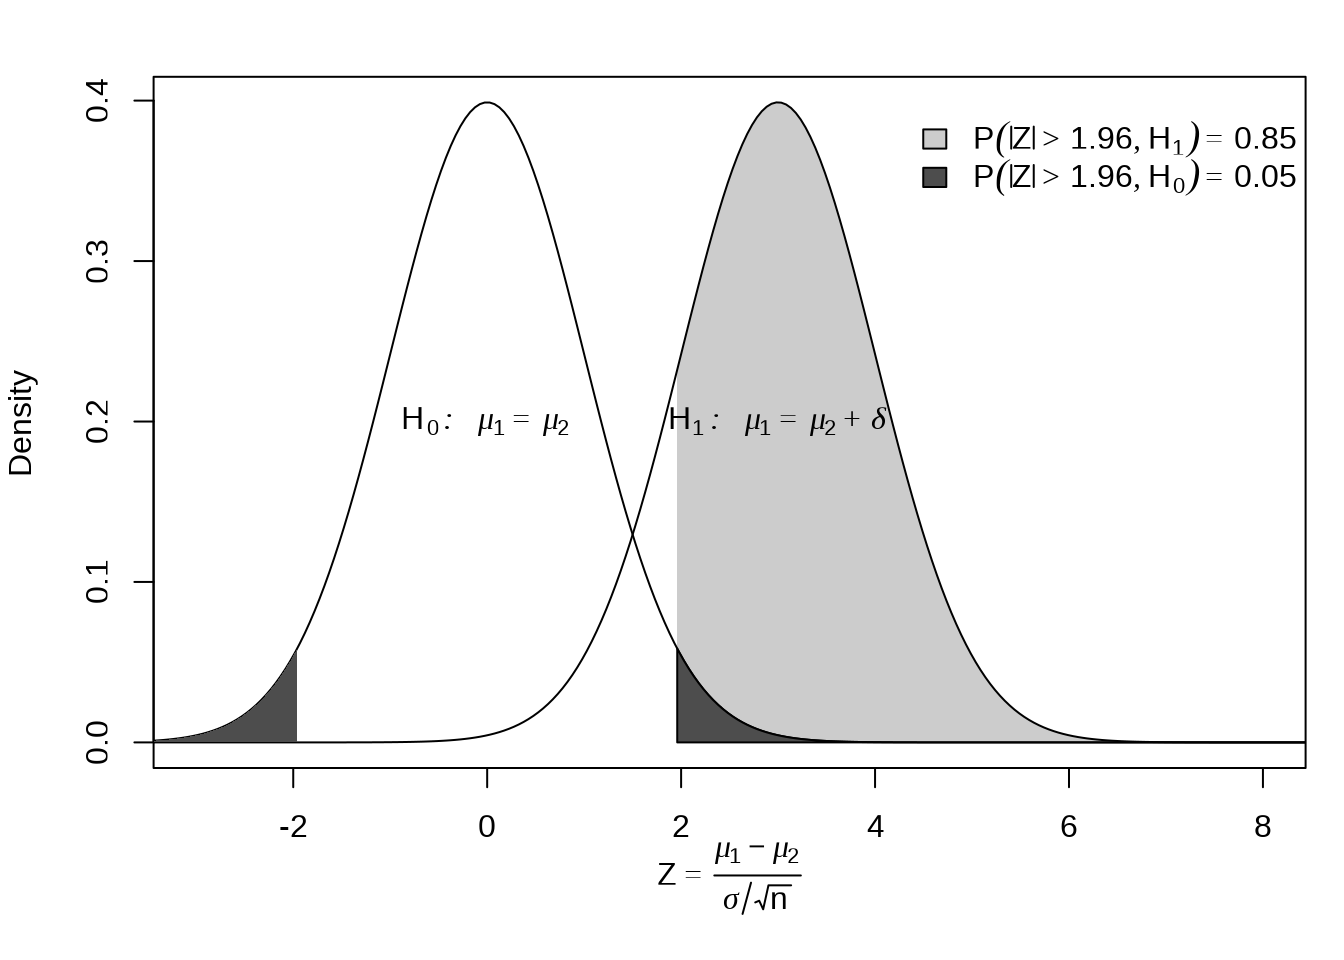
11.2.2 多图布局
data(anscombe)
form <- sprintf("y%d ~ x%d", 1:4, 1:4)
fit <- lapply(form, lm, data = anscombe)
op <- par(mfrow = c(2, 2), mgp = c(2, 0.7, 0),
          mar = c(3, 3, 1, 1) + 0.1, oma = c(0, 0, 2, 0))
for (i in 1:4) {
  plot(as.formula(form[i]),
    data = anscombe, col = "black",
    pch = 20, xlim = c(3, 19), ylim = c(3, 13),
    xlab = as.expression(substitute(x[i], list(i = i))),
    ylab = as.expression(substitute(y[i], list(i = i))),
    family = "sans"
  )
  abline(fit[[i]], col = "black")
  text(
    x = 7, y = 12, family = "sans",
    labels = bquote(R^2 == .(round(summary(fit[[i]])$r.squared, 3)))
  )
}
mtext("数据集的四重奏", outer = TRUE)
on.exit(par(op), add = TRUE)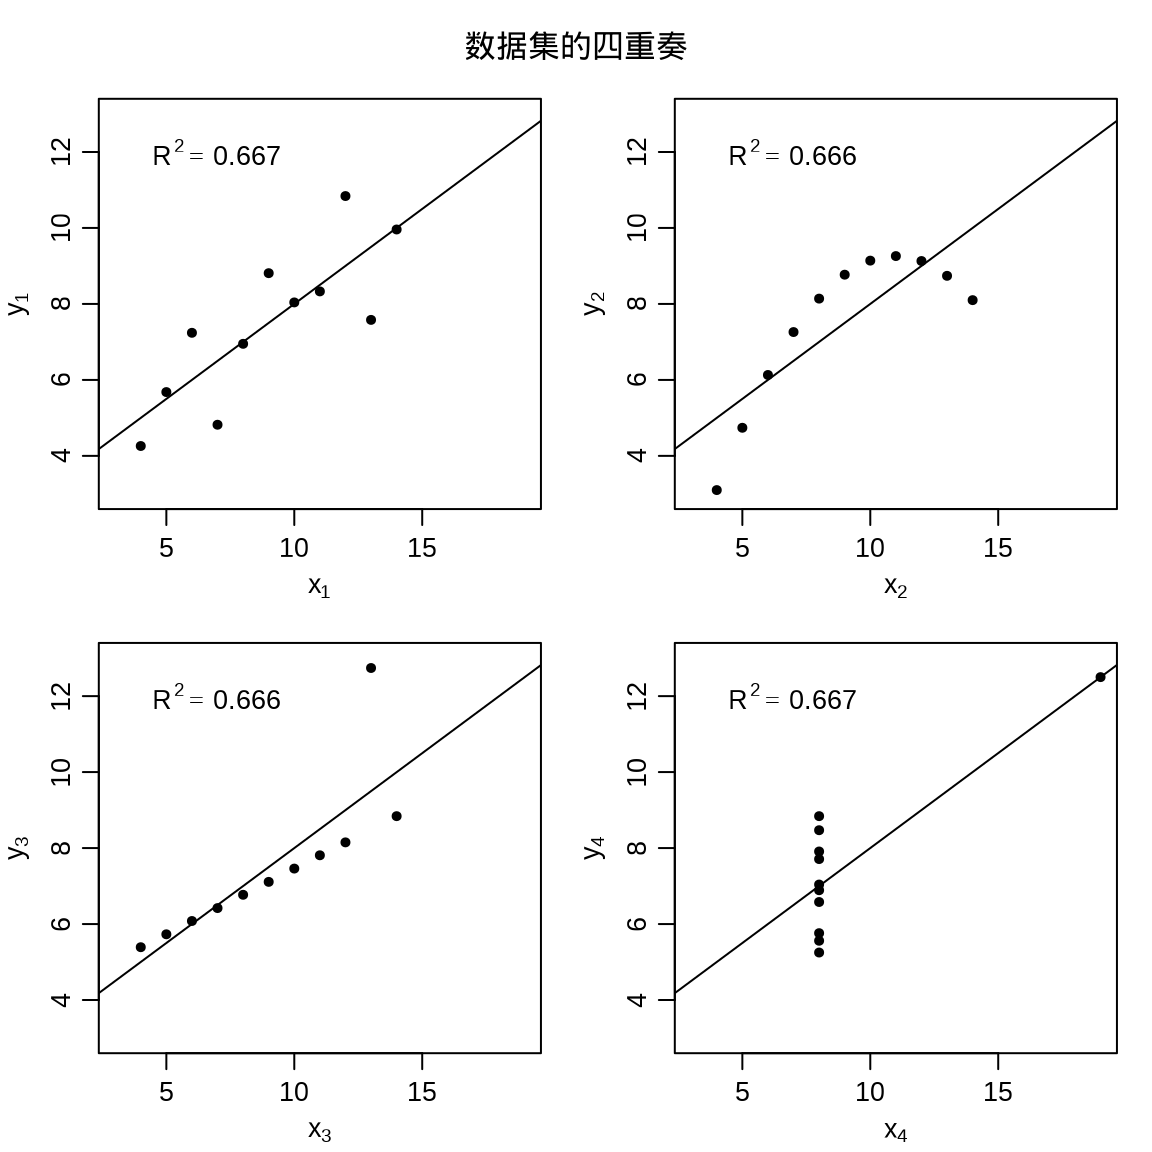
11.3 图形选择
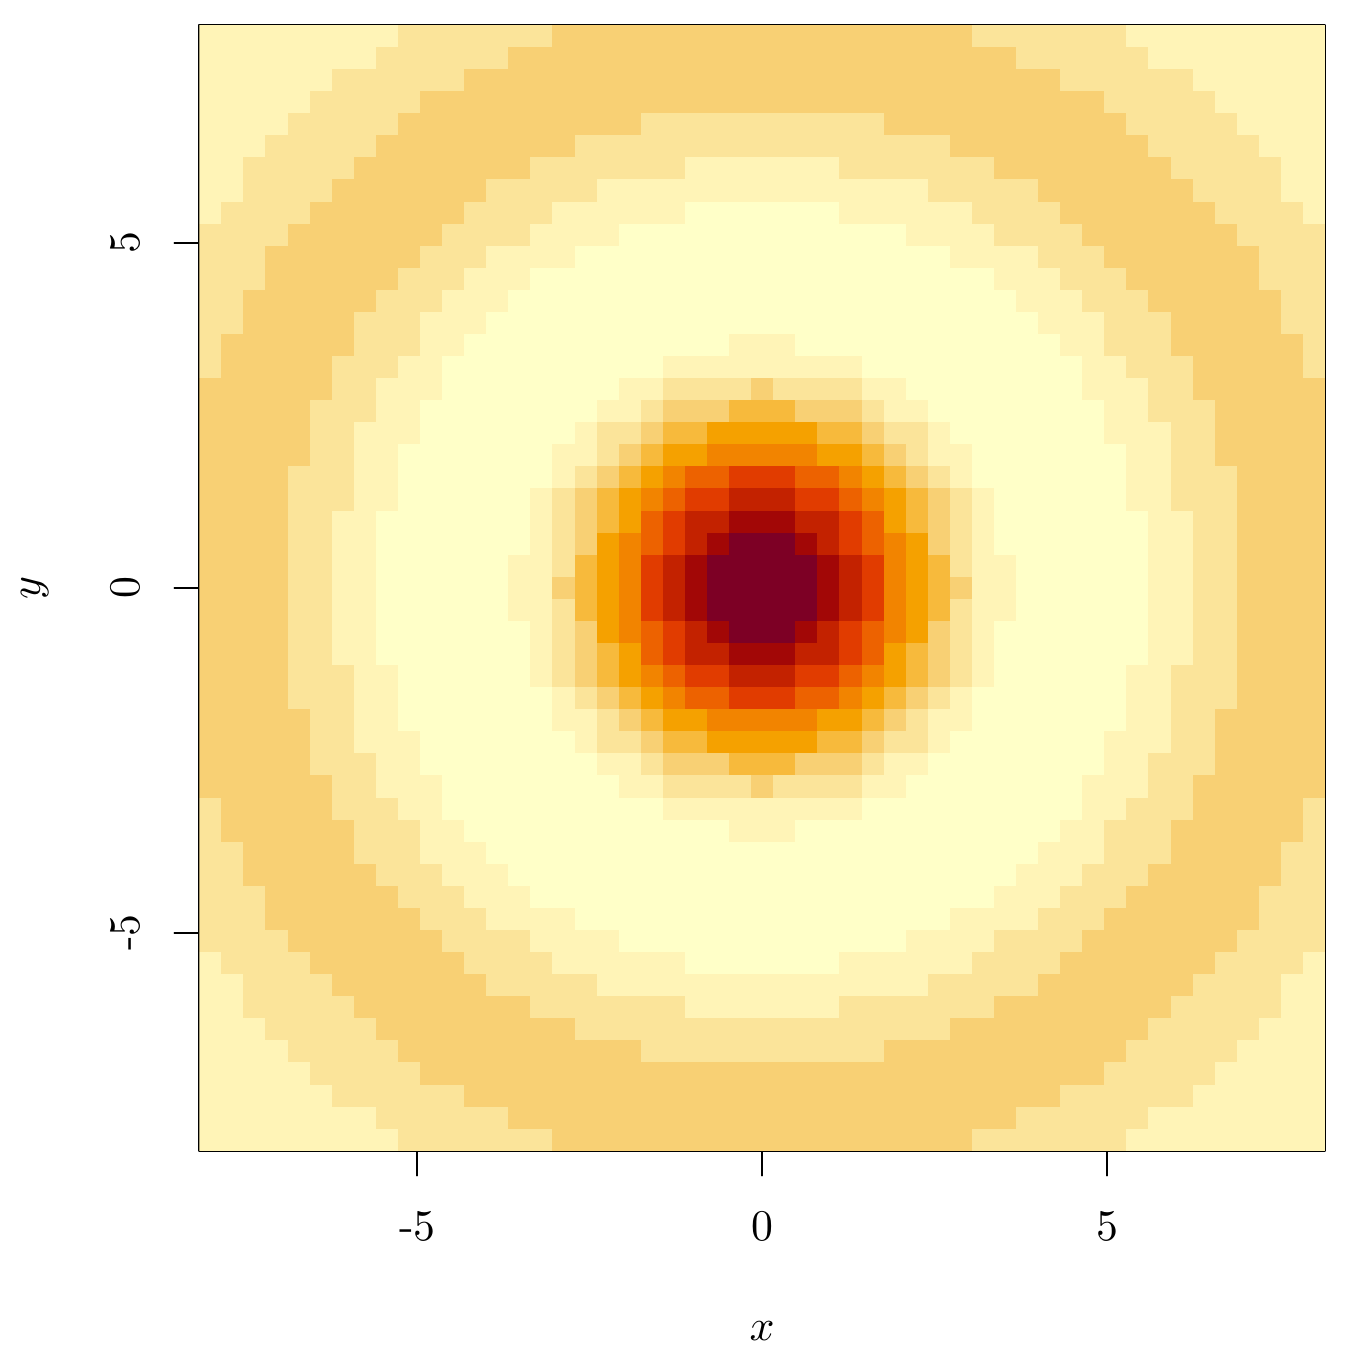
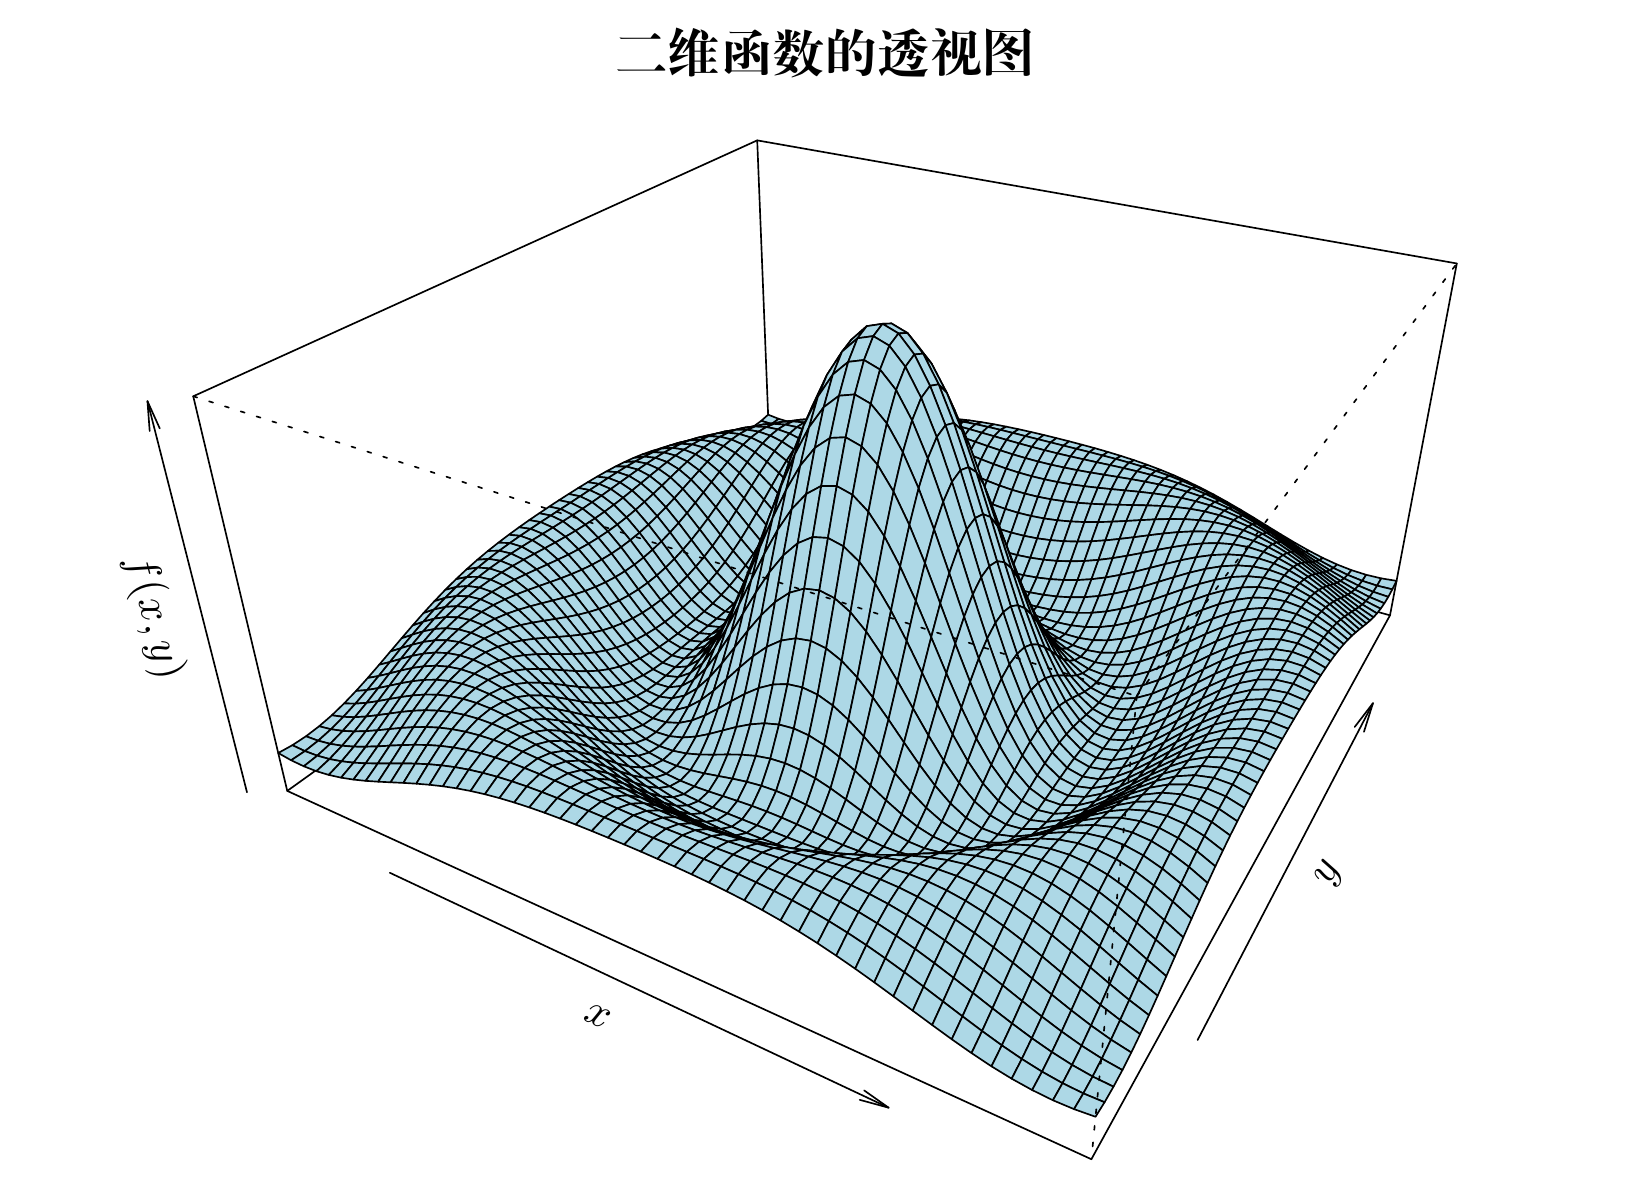
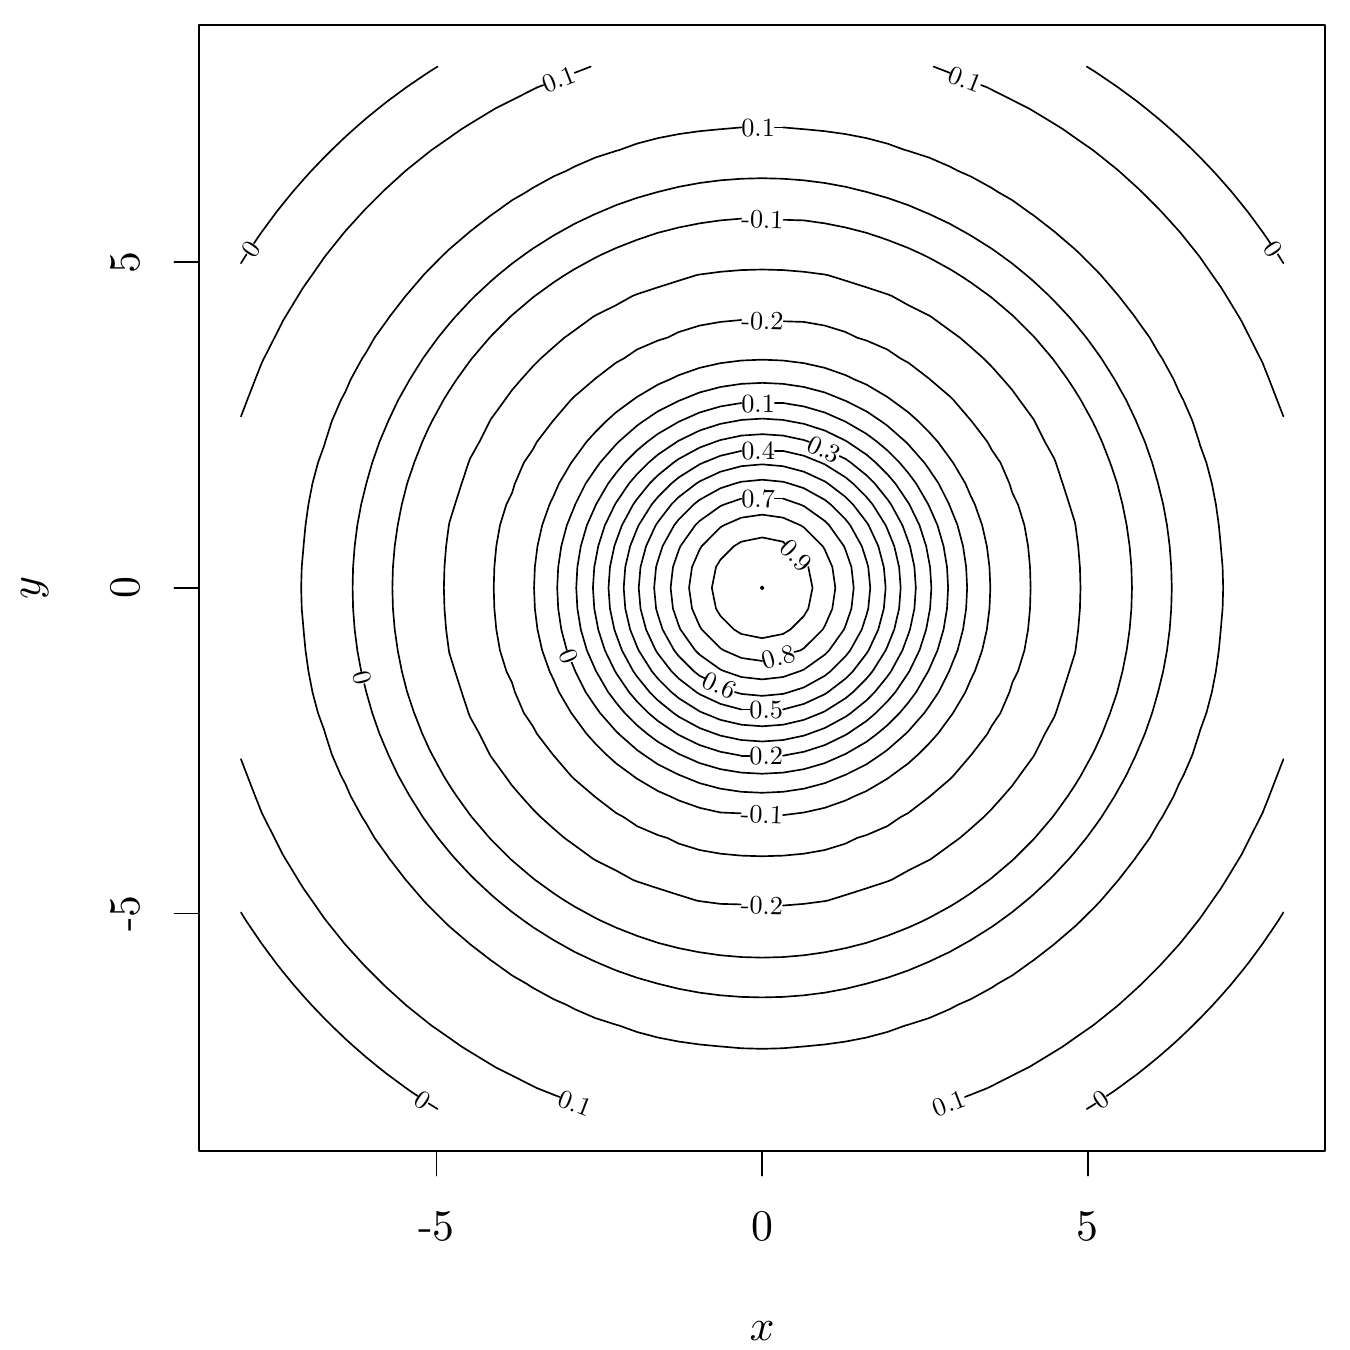
以不同的二维或三维图形可视化同一份多元数据。颜色图、透视图、等值线图和填充等值线图存在某种相似性,又有区别。
11.3.1 颜色图
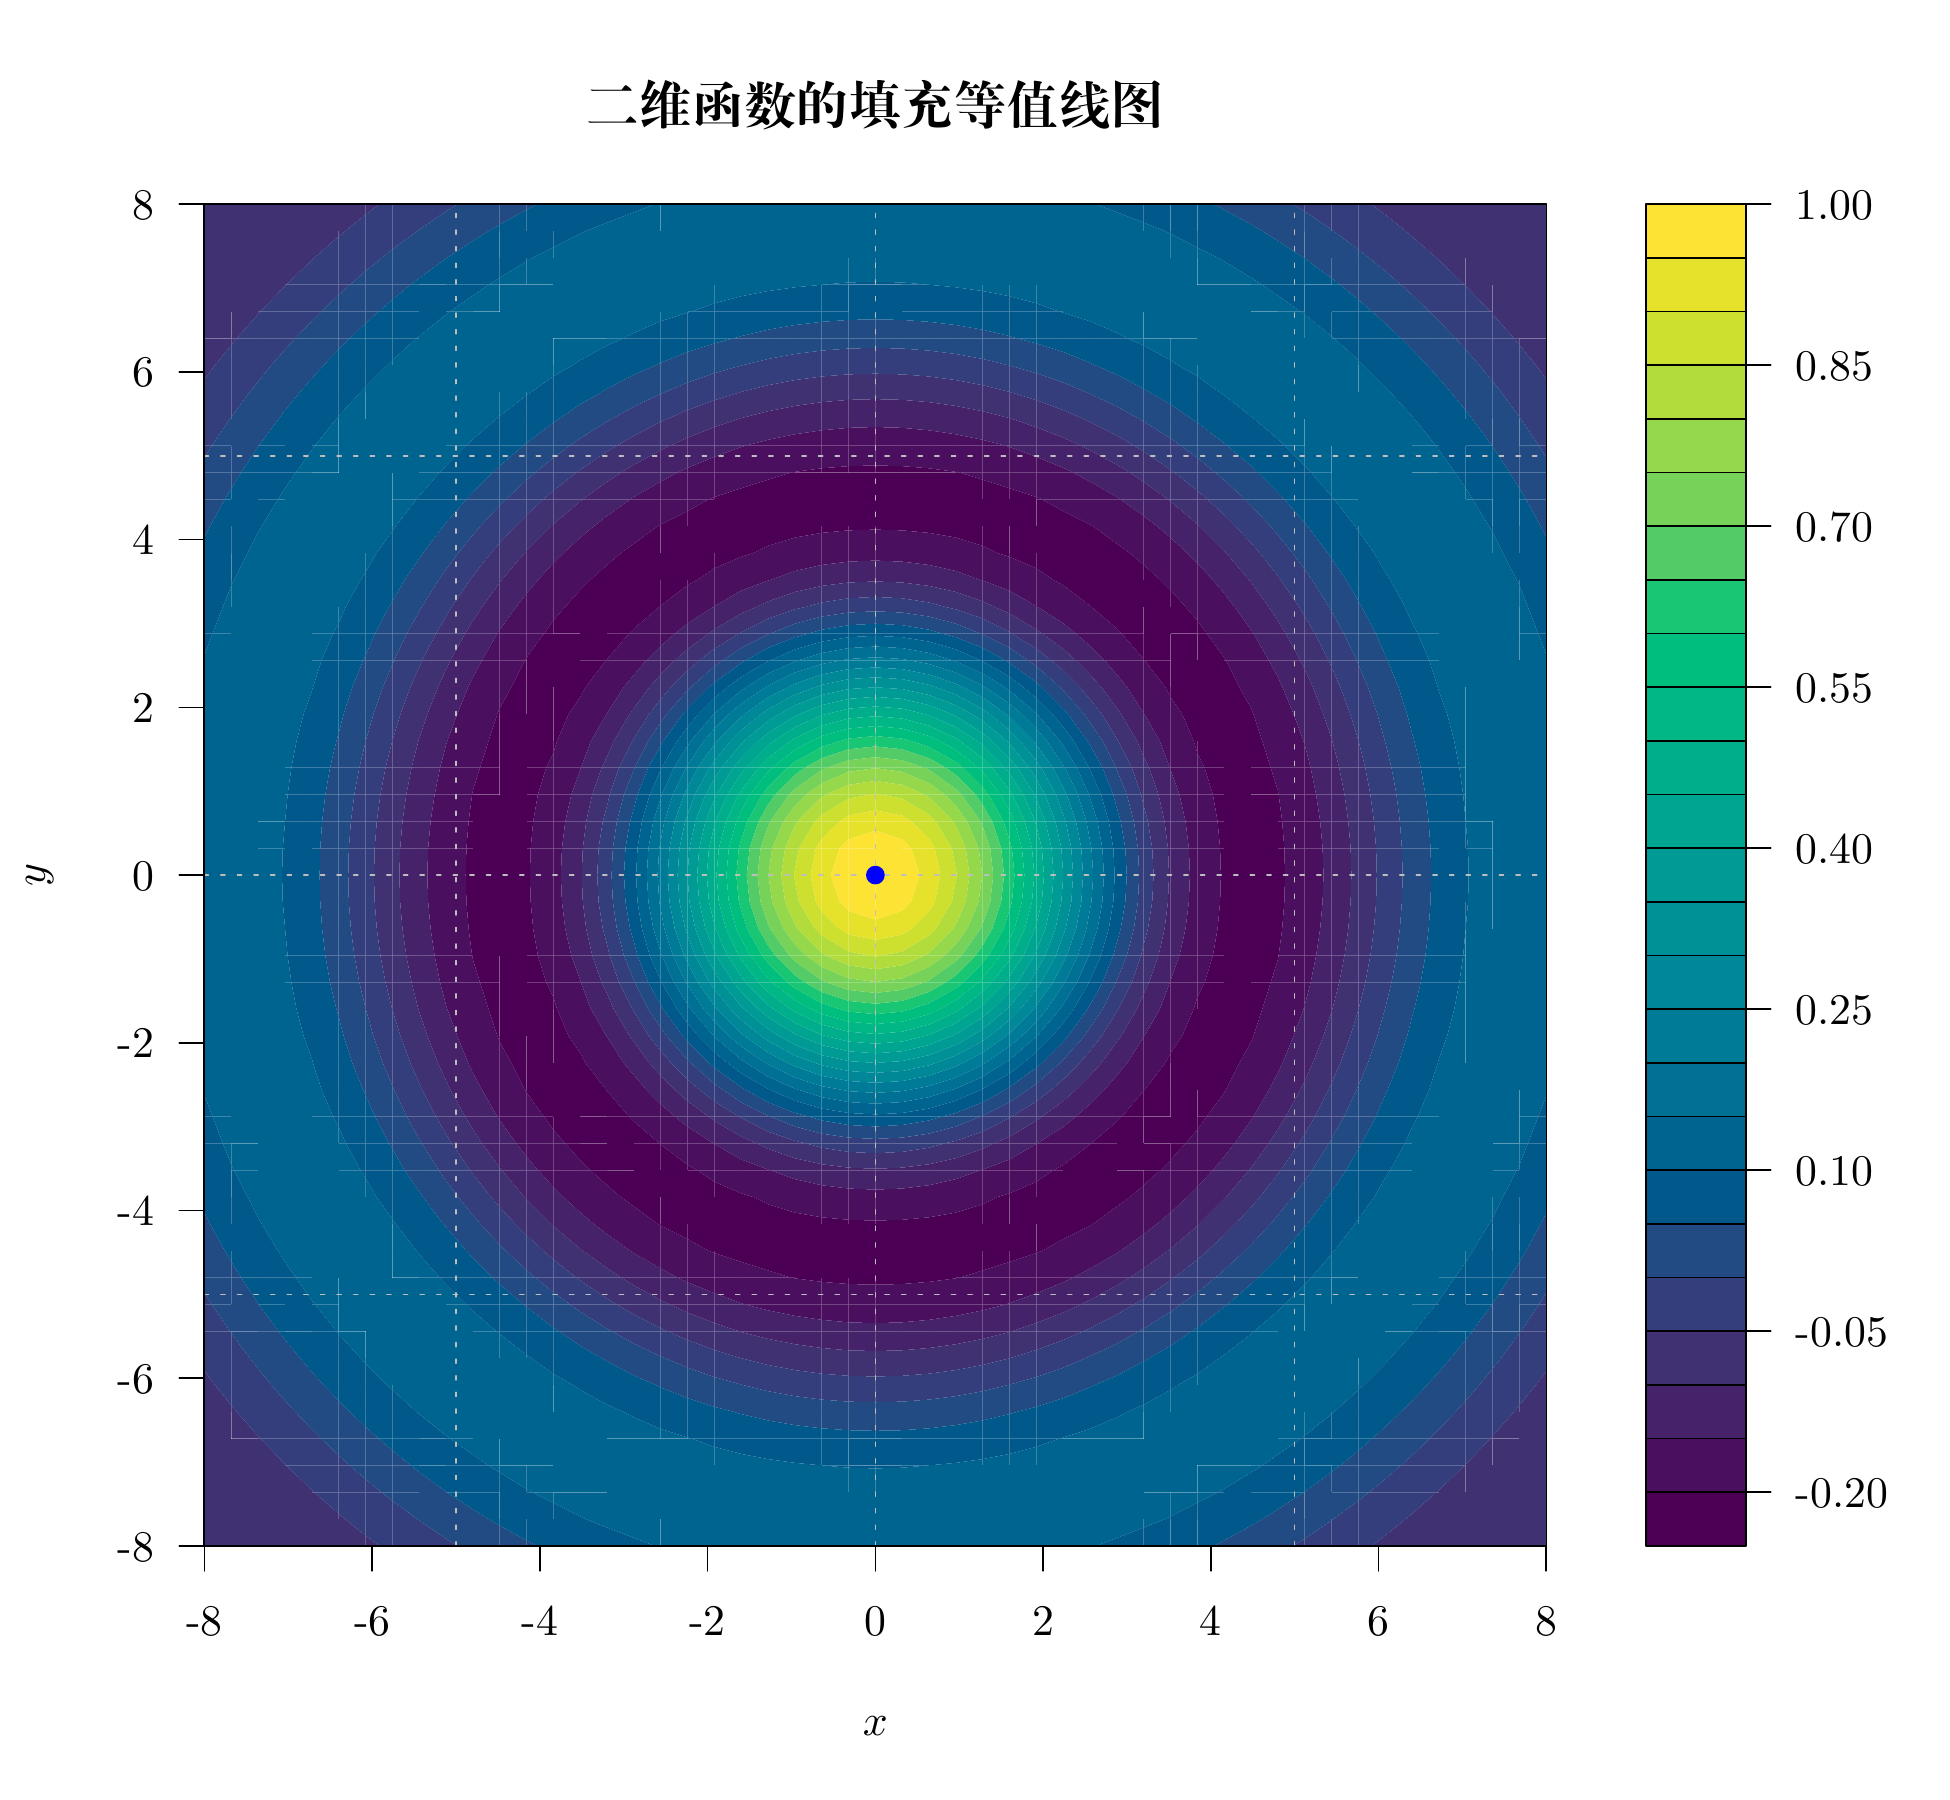
\[ f(x,y) = \begin{cases} \frac{\sin(\sqrt{x^2 + y^2})}{\sqrt{x^2 + y^2}}, & (x,y) \neq (0,0)\\ 1, & (x,y) = (0,0) \end{cases} \]
将绘图区域划分成网格,每个小网格对应一个颜色值。函数 image() 绘制颜色图
11.3.2 透视图
函数 persp() 绘制透视图
11.3.3 等值线图
地理上,常用等高线图描述地形,等高线图和等值线图其实是一个意思。函数 contour() 绘制等值线图。
11.3.4 填充等值线图
函数 filled.contour() 绘制填充等值线图。
filled.contour(
  x = x, y = y, z = z, asp = 1,
  color.palette = hcl.colors,
  plot.title = {
    title(
      main = "二维函数的填充等值线图",
      xlab = "$x$", ylab = "$y$"
    )
  },
  plot.axes = {
    grid(col = "gray")
    axis(1, at = 2 * -4:4, labels = 2 * -4:4)
    axis(2, at = 2 * -4:4, labels = 2 * -4:4)
    points(0, 0, col = "blue", pch = 16)
  },
  key.axes = {
    axis(4, seq(-0.2, 1, length.out = 9))
  }
)
11.4 总结
虽然不提倡大量使用三维图形,但如何绘制三维图形却是生生不息的命题,以下仅是 R 语言社区的冰山一角。
plotrix (Lemon 2006) 一个坐落于 R 的红灯区的 R 包。基于 Base R 各类绘图函数。
scatterplot3d (Ligges 和 Mächler 2003) 基于 Base R 绘制三维散点图。
misc3d (Feng 和 Tierney 2008) 绘制三维图形的杂项,支持通过 Base R、 tcltk 包和 rgl 包渲染图形。
plot3D (Soetaert 2021) 依赖 misc3d 包,加强 Base R 在制作三维图形方面的能力。
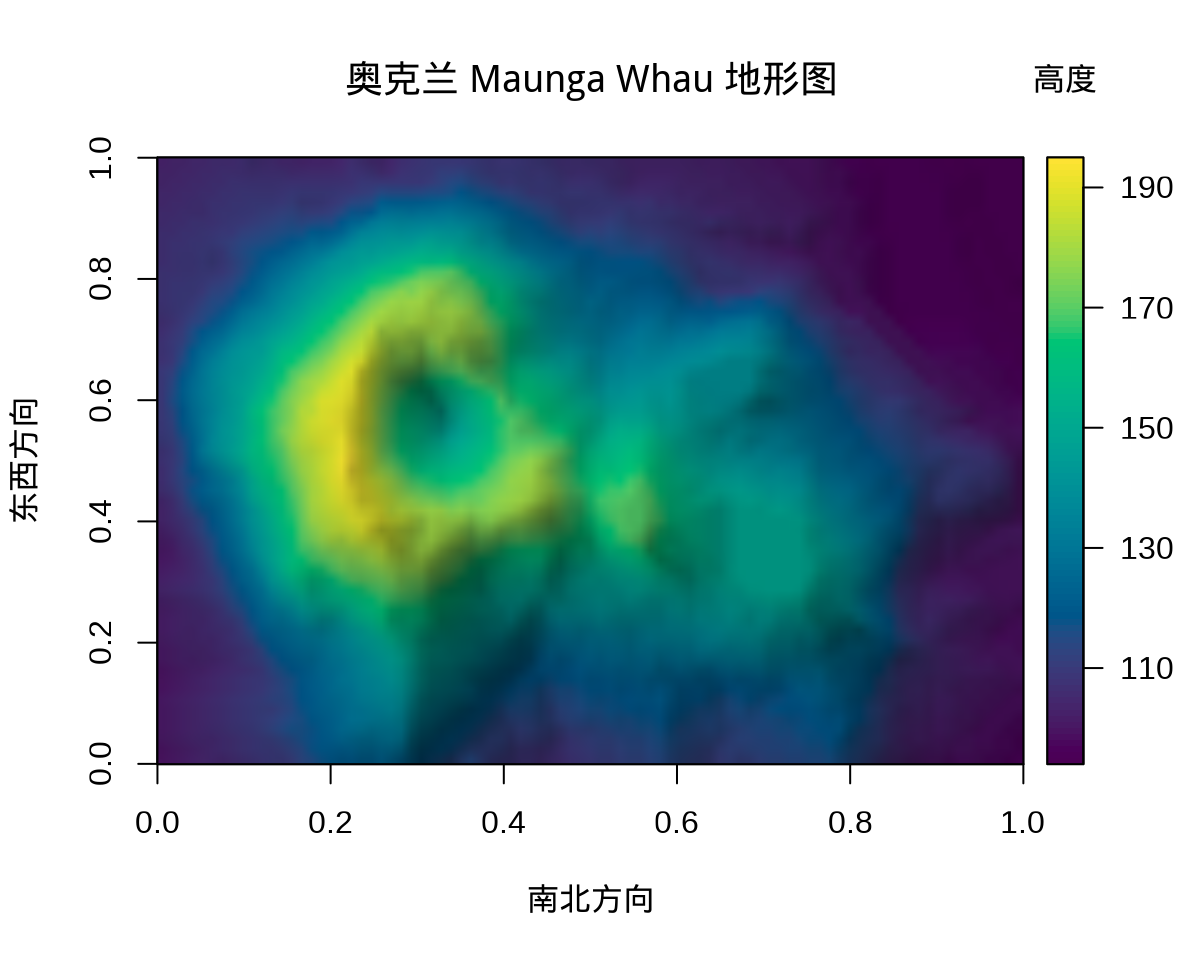
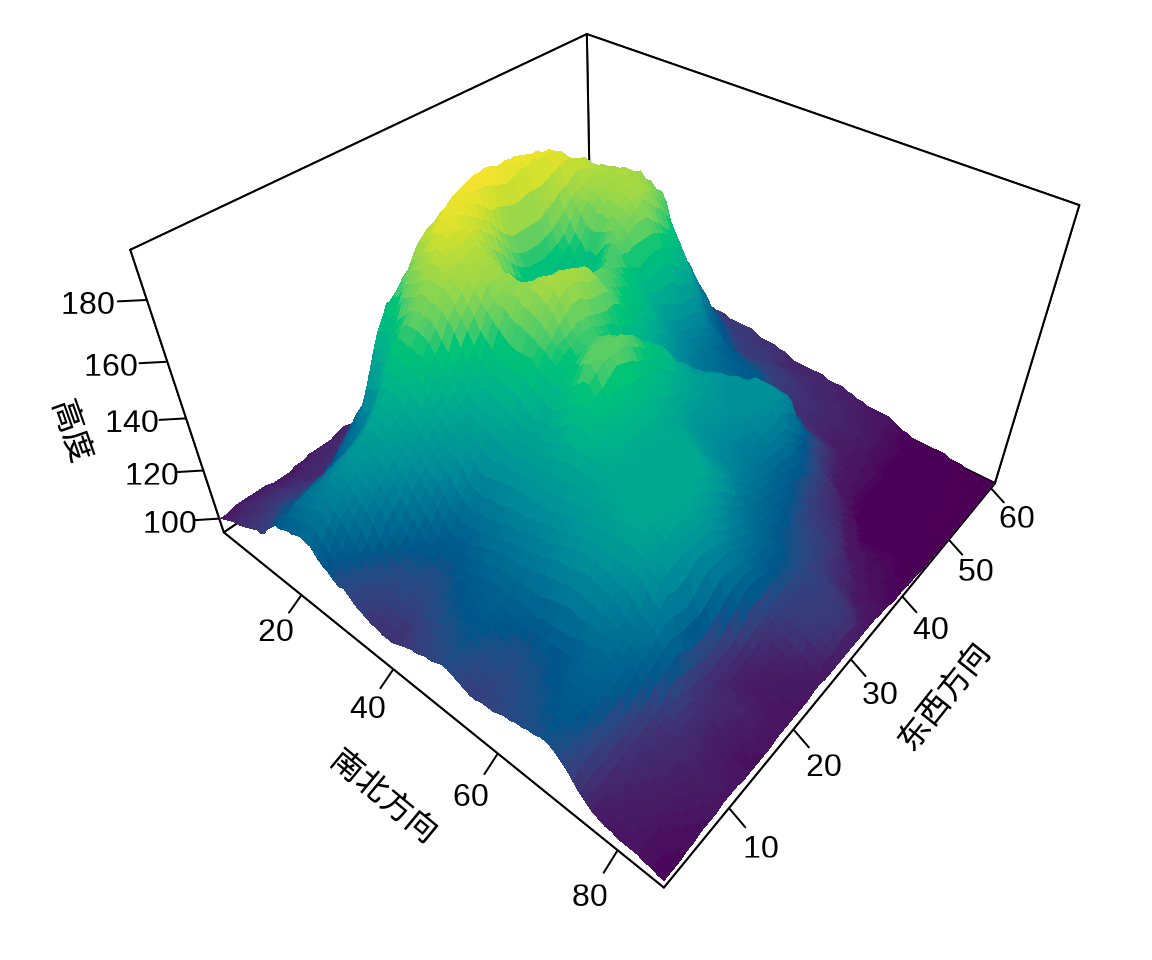
举个比较新颖的一个例子,plot3D 包的函数 image2D() 绘制二维颜色图,细看又和 image() 函数不同,渲染出来的图形有三维的立体感。归根结底,很多时候束缚住自己的不是工具,而是视野和思维。以奥克兰 Maunga Whau 火山地形数据 volcano 为例。
